Naver Data Lab: How to gain insights on Korean search trends
Dominating 64% of the local search market, Naver is the #1 most popular search engine in Korea. But how can you obtain data or marketing insights from Naver?
Launched in 2016, Naver Data Lab is Naver’s comprehensive keyword research tool that helps you find popular keywords by category and region. And while Naver Data Lab is similar to Google Trends, there are functional differences, like Naver Data Lab’s filters for search terms by device, gender, and age.
To help you find Korean search trends, let’s explore the various functions within Naver Data Lab and compare its similarities and differences with Google Trends.
WHAT IS Naver Data Lab
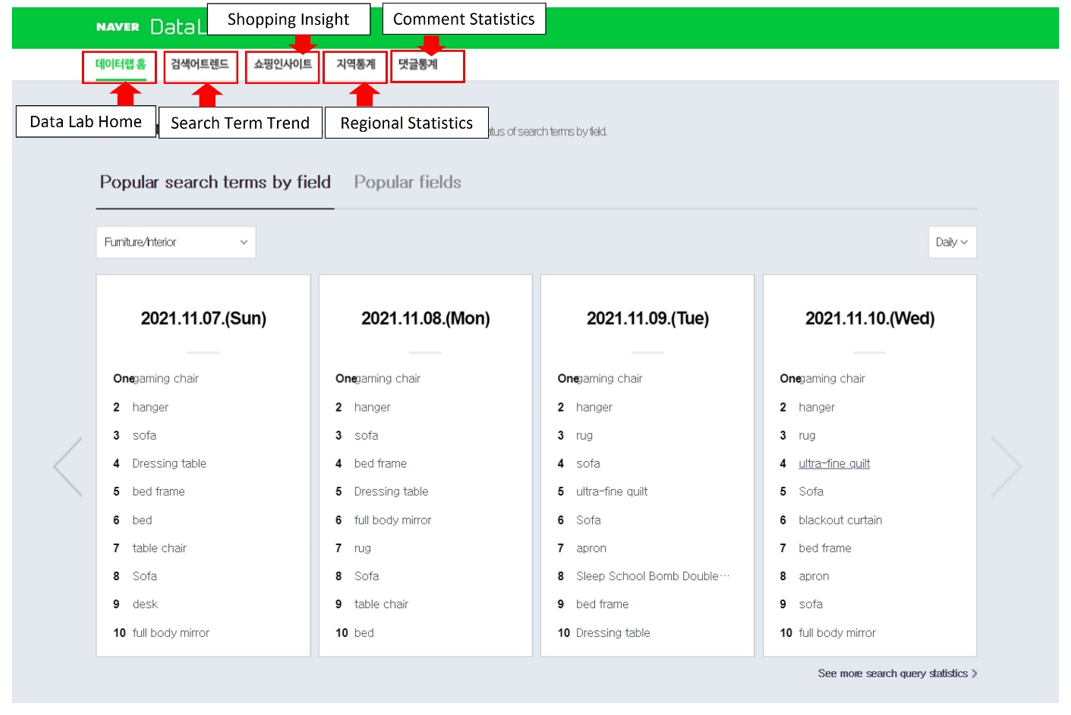
Homepage of Naver Data Lab: Five navigational tabs
Naver discontinued its real-time search service in March 2021 as it became overly used by companies to advertise. Since then, Naver Data Lab has been the go-to platform for finding Korean search trends.
Naver Data Lab’s interface is structured into five navigational tabs for each of its primary functions:
- Home (데이터랩 홈): The homepage gives an overview of the insights from each of the platform’s main functions.
- Search Term Trend (검색어 트렌드): This tab has graphs illustrating keyword search volumes per search term.
- Shopping Insights (쇼핑 인사이트): This tab shows statistics on categories (i.e., search volume trends by category field) and search term (i.e., in-depth keyword analysis per term).
- Regional Statistics (지역 통계): Here, you can check popular search trends by region with data from Naver and BC Card, South Korea’s largest payment processing company.
- Comment Statistics (댓글 통계): This tab displays an overview of comments made on Naver News.
Pro-Tip: While there are no official English versions of Naver or its tools, you can use your browser to auto-translate pages into English.
With a grasp of Naver Data Lab’s layout, let’s walk-through each function and how to leverage their data insights to improve your site performance on Naver.
Naver Data Lab Home
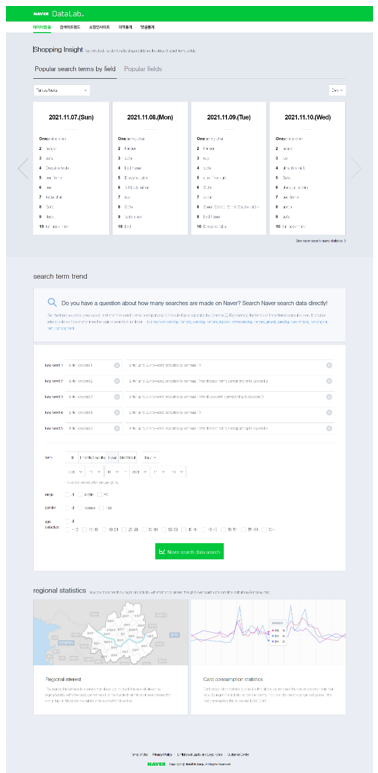
Naver Data Lab: Homepage
At the top of the homepage are shopping insights based on popular keywords per category (fields) and sub-category. The 12 main categories are as follows:
- Fashion (clothing)
- Fashion (accessories)
- Beauty & cosmetics
- Digital appliances
- Furniture & interiors
- Baby products
- Food
- Sports
- Healthcare & social services
- Leisure & culture
- Duty-free shopping
- Books
You can also filter data by a time range, like a week or month.
And below the section for popular search terms, you can easily jump to the search term tool and regional statistics.
Search Term Trends
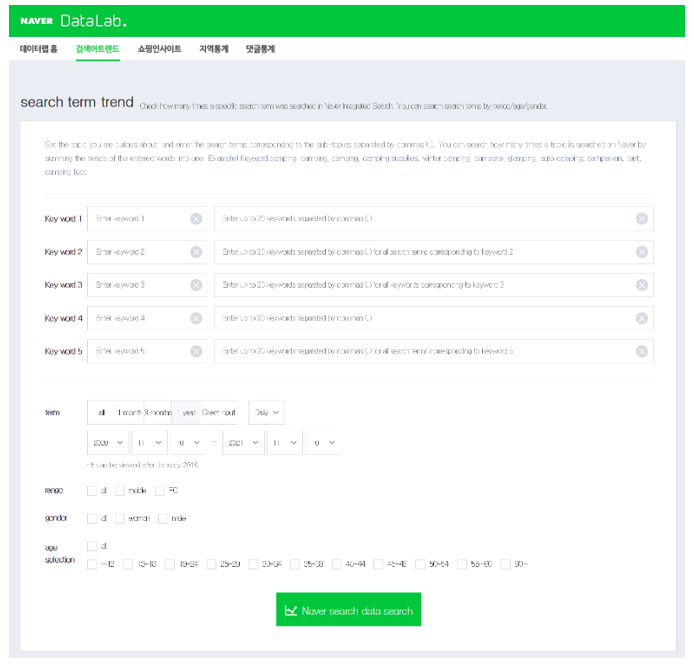
Naver Data Lab: Search term trends
Search term trends come in handy for identifying keyword trends among Naver’s captive 42 million users.
First, select up to five topics based on the keywords you are querying. Then, enter any secondary keywords related to the topic and separate them by commas (,).
You can add up to 20 keywords per topic. For example, when searching the keyword “table”, you can supplement your search with secondary keywords like “four-person table”, “folding table”, “dining table”, and so on.
Again, you can filter the data by a time range, whether that’s one month, three months, or a year. To narrow your search further, there are also filters for device, gender, and age.
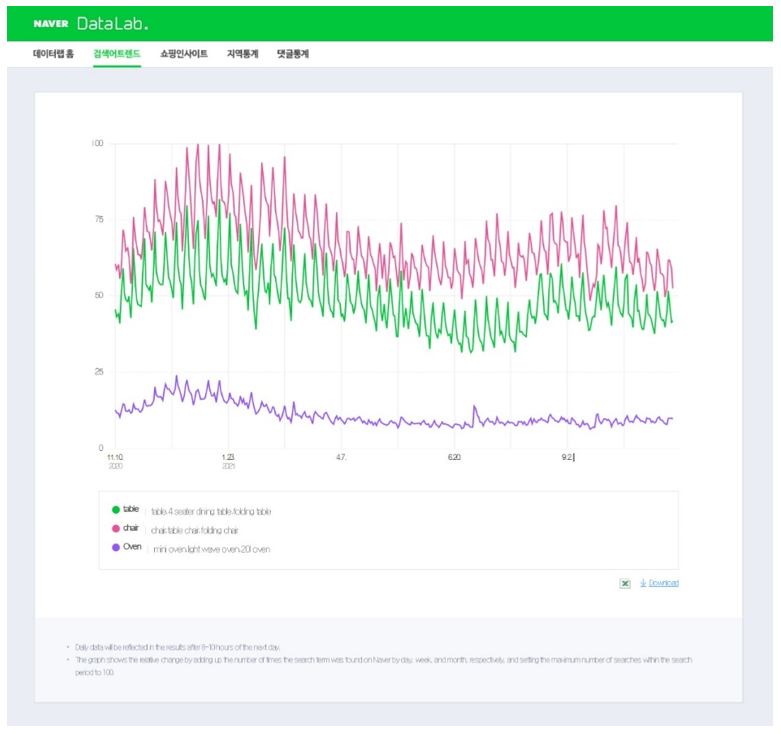
Naver Data Lab: Search term trend statistics
After setting your parameters, Naver Data Lab shows you how many times a topic is searched on Naver by aggregating the search volumes of your entered keywords into a single trend.
The accompanying graph shows the daily, weekly, and monthly searches on Naver for the trends you wish to analyze. It also sets the total search volumes for these trends on a relative scale from 0 to 100; if the search volume figure for January is 100 and 75 in June, then searches in those months have dropped 25%.
So, like Google Trends, Naver Data Lab compares keyword trends relative to each other—instead of using their real-time search volumes—but from Naver-owned properties like Naver Café, Naver Blog, and Naver Shopping. A difference between the two, however, is that Naver Data Lab provides additional data filters for device, gender, and age.
Let’s explore how these filters can help you understand target market demographics when analyzing shopping insights.
Shopping Insights
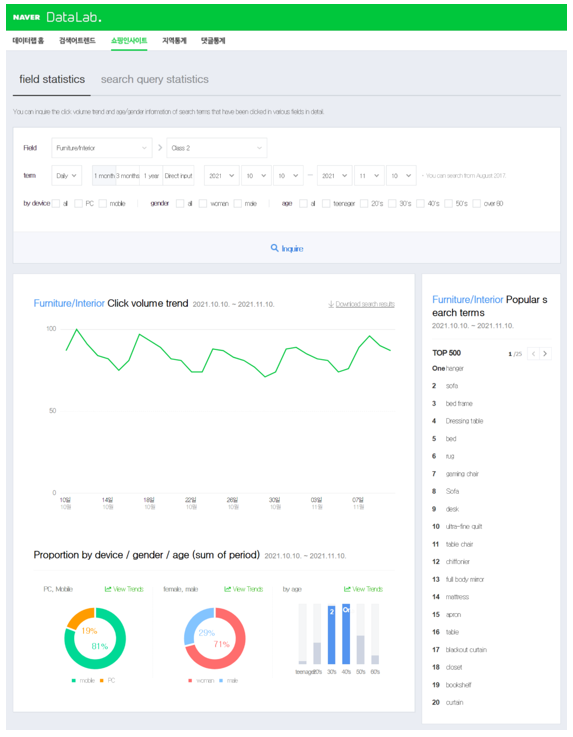
Naver Data Lab: Shopping insights by category
Naver Data Lab’s shopping insights gives you detailed statistics of each category (field) and illustrates these with various graphs for click volume trends based on time range, device, gender, and age.
For instance, the graphs above denote that clicks for furniture/interior-related product listings are heavily attributed to mobile users (81%) and females (71%), so brands in that category can leverage this information for their targeting strategy.
On the right-hand sidebar, you’ll notice the 20 most popular search keywords relating to the category you searched, which may feed you with more elaborate keyword discoveries.
After analyzing a particular category, you can generate detailed keyword analysis. First, select a category (field) and separate the keywords with commas, then set a time range for your data before filtering by device, gender, and age.
Aside from viewing the overall trend, you can also compare the click volumes for each keyword within your specified category.
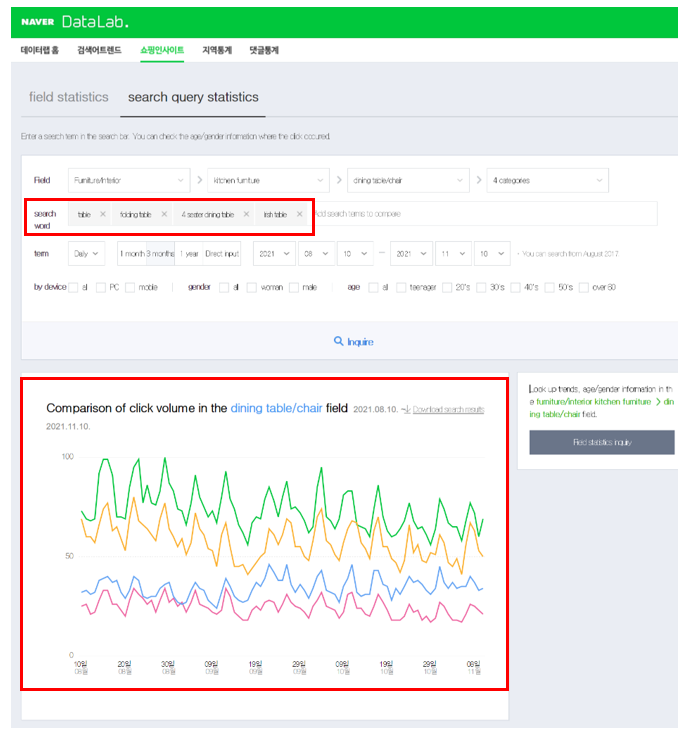
Naver Data Lab: Search query stats under shopping insights
On the other hand, Google Trends has 25 categories distinct from Naver’s, ranging from education to property to law.
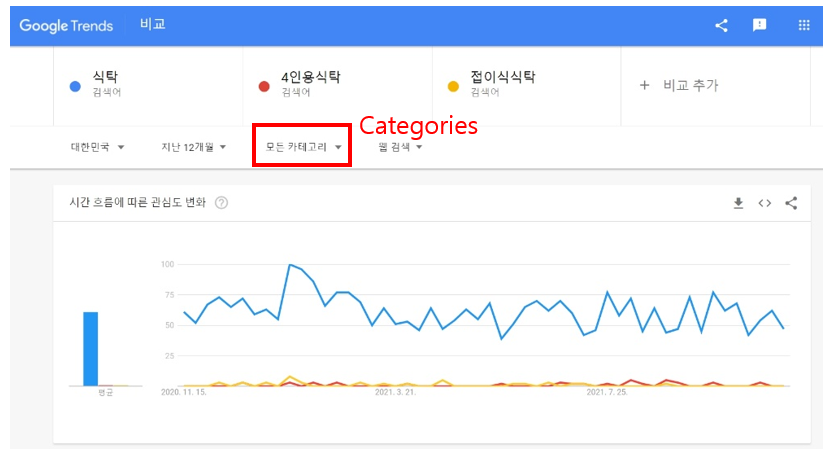
Keyword comparison on Google Trends
Regional Statistics
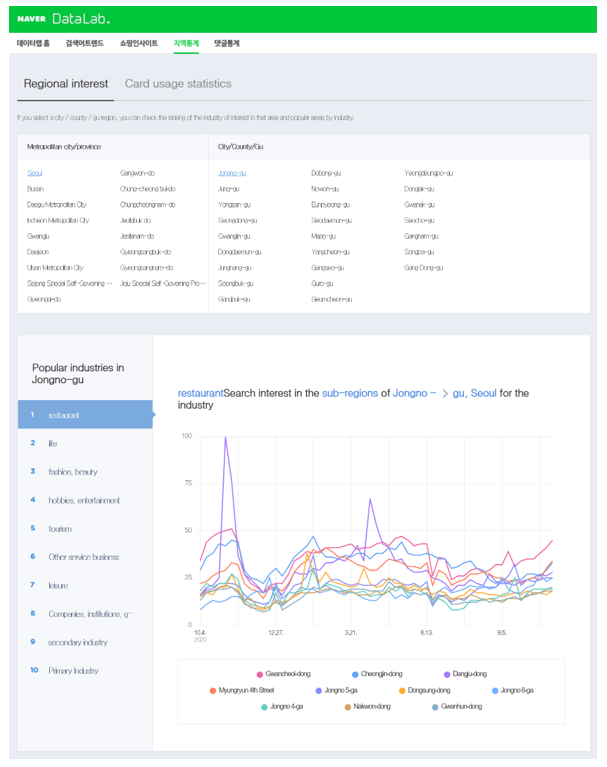
Naver Data Lab: Categorical interest by region
Regional statistics reveals the interest levels for each category by region.
You can filter the data by city and/or county (or Gu) and check the search interest level—on a relative scale from 0 to 100—for the 10 most-searched industries in that area, which is based on search terms on Naver.
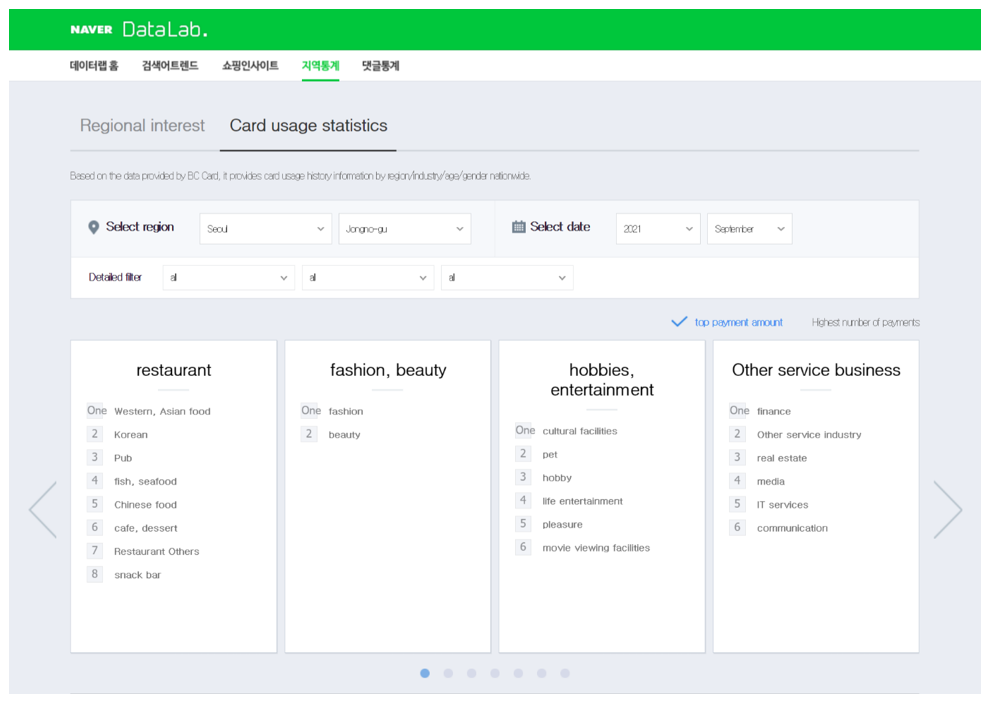
Naver Data Lab: Card usage stats under regional statistics
Another key difference between Naver Data Lab and Google Trends is that the former also measures search interest based on payments made by BC cardholders, thereby letting you see the categories with the highest purchase volumes by region.
Comment Statistics
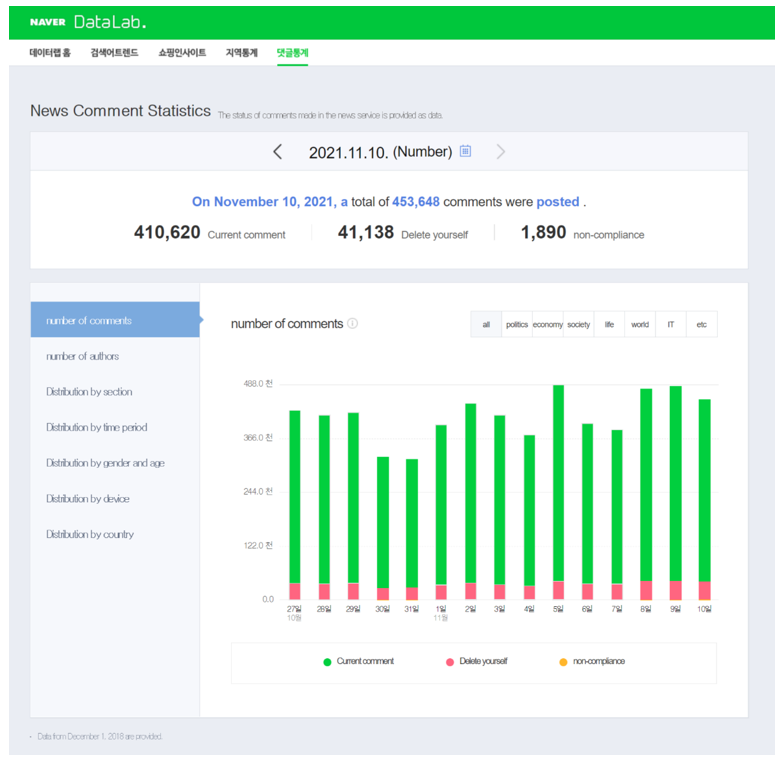
Naver Data Lab: Comment statistics
Lastly, comment statistics show you the status of comments made on Naver News articles, revealing the number of comments per category and their distribution by gender, device, and country.
Naver Data Lab vs Google Trends
The similarity between Naver Data Lab and Google Trends is that both platforms compare keyword trends on a relative scale, so while you cannot view exact search volume figures, both platforms paint a better picture of trends over time.
A difference is that data from Google Trends is pulled from a global database while data from Naver Data Lab is more localized since it is pulled from Naver-owned properties, which are all in Korean. The search filters to view the data are quite different as well.
Here’s a comparison of the similarities and differences between Naver Data Lab and Google Trends.
Naver Data Lab vs Google Trends: Similarities
- Both tools let you compare the trends of up to five keywords.
- Both tools generate graphs comparing keyword trends over time on a relative scale.
Naver Data Lab vs Google Trends: Differences
Naver Data Lab
- Search data is pulled from Naver-owned properties, giving you more localized data.
- You can select up to five secondary keywords (in addition to the main keyword) under search query statistics.
- Filters include time range, device, gender, and age.
- Data can be downloaded as CSV files.
Google Trends
- Search data is pulled from a global database, with the choice to filter by country.
- Filters include keyword category and additional search options like images, news, or YouTube.
- More options for sharing your data, including downloading it as a CSV file and sharing via embedded codes or on social media.
***
Analyzing keyword trends with a holistic data approach is essential for understanding your target consumers’ behaviors—even more so if your business operates in a niche or highly sophisticated industry.
So, whether you want to improve brand visibility on Naver (or any other search engine in the world for that matter), you must familiarize yourself with its keyword research tool to help you target the right keywords—and ultimately serve the right audience.