A Beginner’s Guide to Google Analytics 4
As of July 1st 2023, Google has officially retired Universal Analytics (UA) and ushered in the new era of Google Analytics 4 (GA4). If you’re asking “what is GA4?” and eager to acquaint yourself with its offerings, you’ve certainly come to the right place! This beginner-friendly guide will set you up for success on GA4, walking you through its interface, reports setup, configurations, and much more.
Before You Read On…
This article is part two of a three-part GA4 series that we’ll be publishing and covers:
- Key differences between UA and GA4
- GA4 Beginner Tutorial (this article)
- GA4 Advanced Tutorial (to be published soon)
With that said, after reading this blog, you’ll understand:
- What is GA4
- What are the key features of GA4
- How to use GA4 reports
- How to track events and conversions with GA4
What is GA4?
Google Analytics 4, or GA4, is a powerful analytics tool that can help you draw more meaningful insights about your users and inform your marketing decisions. It is the latest generation of Google Analytics that’s replacing its predecessor, Universal Analytics., though with limited adoption by many marketers until now.
GA4 is different from UA in several ways. Firstly, GA4 employs sophisticated AI and machine learning models to extract intelligent insights from data. It can, for instance, alert you to vital trends such as a surge in product demand due to changing consumer interests. Additionally, GA4 regularly integrates new predictive metrics, enabling the identification of high-value customers and understanding their spending patterns to boost results.
Moreover, GA4 moves away from fragmented tracking to present an integrated, customer-focused view across multiple platforms and devices. It achieves this by utilizing various identity spaces, including User IDs provided by marketers and unique signals from Google. This allows you not only to gain a holistic view of your customer interactions but also to comprehend your customers’ lifecycle fully, from acquisition, conversion, to retention.
Lastly, GA4 prioritizes privacy. By adhering to privacy laws like the CCPA and GDPR, and granting data control to the users, GA4 fosters trust between you and your audience.
Key Features of GA4
1. Customize Pre-Defined Reports
Universal Analytics lets you add a secondary dimension to predefined reports, but that’s where its flexibility ends. It doesn’t allow you to view other metrics or change dimensions.
In GA4, an edit icon is conveniently placed above the tables, offering you the ability to tailor pre-defined tables to meet your business needs. Simply select the desired dimensions and metrics for view. The added advantage is being able to save your preferences, assuring that upon returning to the report, your custom settings remain intact.
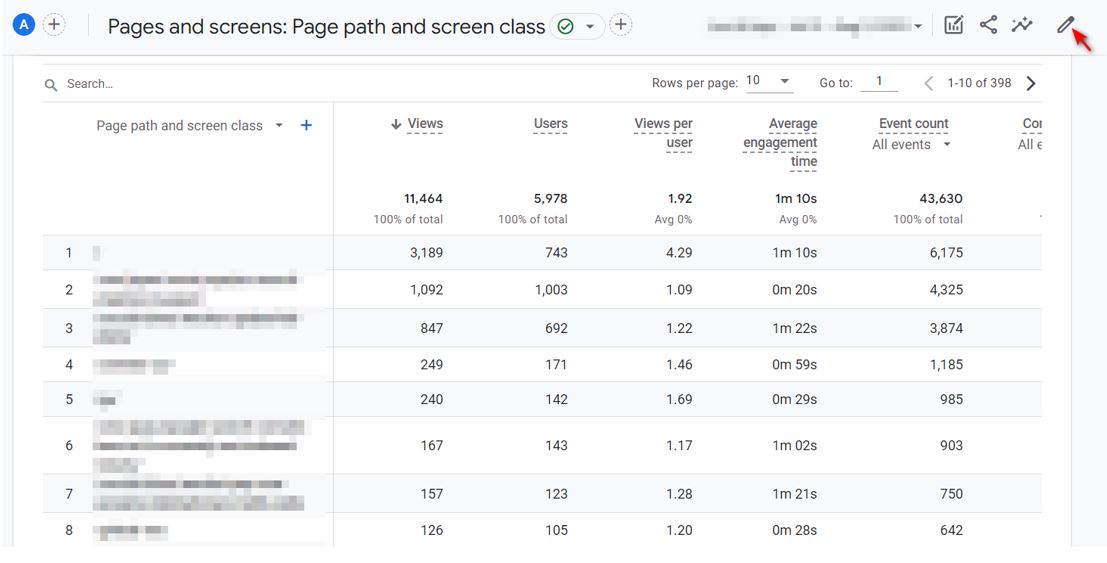
GA4 new features: Customize pre-defined reports
Alt txt: GA4 new features: Customize pre-defined reports
2. Create Custom Reports
While Universal Analytics lets you create dashboards, GA4 takes data reporting a notch higher. In the Exploration section, you can craft custom reports that align with your specific needs.
You have the option to begin with a blank report or select from pre-defined templates like the free-form report and funnel exploration report. You then can customize the segments, dimensions, and metrics, thus facilitating a better understanding of the data and fresh insight generation.
Once you create a custom report in Explore, you can share it with designated people, print it as a PDF, or save it as an Excel workbook.
3. Track Events with Flexibility
GA4 introduces a tracking system where everything is accounted for as an event. This allows you to monitor a wide range of actions or information of interest – from page views to specific button clicks. Unlike Universal Analytics which confines you to a set of pre-defined “hit” types, GA4 offers more flexibility in tracking data significant to your business.
In addition, GA4 utilizes event parameters to attain more detailed information about an event. Consider the page location parameter as an example; it divulges the URL of the page currently viewed. In a similar vein, the page referrer parameter reveals the page viewed prior to the current one. GA4 automatically dispatches these parameters with each event, thus enabling analysis of their data using specific dimensions and metrics.
4. Enrich Data with Predictive Metrics
Apart from past behavior reporting, GA4 also forecasts future visitor activities. Using visitor data and Google’s machine learning algorithms, GA4 estimates purchase and churn probabilities, along with predicted revenue for upcoming weeks. These predictions allow you to identify potential converters, which helps you with the efficient allocation of your marketing budget. Therefore, with GA4, planning for the future is data-driven and well-informed.
DON’T HAVE A GOOGLE ANALYTICS ACCOUNT? START WITH A DEMO ACCOUNT
If you don’t have an existing Google Analytics account, you can try out Google’s GA4 Demo Property to explore the functions and capabilities of GA4. To access the demo account, ensure you’re logged in to your Google account, then click the link below to automatically access the GA4 Demo data.
GA4 HOMEPAGE INTERFACE
When you first log in to your GA4 account, you’ll be greeted by a homepage overview of your property’s overall traffic, user engagement, and revenue earned. It is best used as a quick check to ensure everything behaves as expected.
(A) Navigation: Here, you’ll find pre-built reports that you can use to analyze data from your websites and apps.
(B) Overview: A snapshot of key metrics that you check most on GA4. For instance, if you regularly dive into the sessions metric, GA4 will deem that as a key metric based on your behavior and add it to the report overview.
(C) Realtime: Sourcing data from the Realtime Report, this card displays your property’s real-time user activity, specifically the number of site visitors (i.e., users) during the last 30 minutes and the countries (up to five) where they are based.
(D) Recently Viewed: This card provides you with easy link access to recently visited pages and sections on your account.
(E) Insights: This dashboard highlights unusual changes or emerging trends in the data from your site or app. You can also custom-set conditions for your data that, when triggered, will generate insights you deem most important to you.
(F) Admin: A shortcut to the admin settings of your property, where you can create new properties, change user permissions, add integrations, set up filters, import data, and more.
GA4 REPORTS
GA4 provides pre-built reports that you can leverage to analyze data from your websites and apps. However, with so much data available on your GA4 account, it can be easy to feel overwhelmed and fall into a state of analysis paralysis.
Don’t fret! In this next section, we’ll break down the different types of reports available on GA4.
Standard reports on GA4 can be broadly classified into two major buckets (or collections) called:
Life Cycle Collection: These reports help you visualize and analyze data according to the four stages of the customer lifecycle, which are:
(A) Acquisition: Summarizes where new and returning users come from
(B) Engagement: Summarizes user activity by event count
(C) Monetization: Highlights the revenue generated from items, ads, and subscriptions on your website or app
(D) Retention: Covers how effectively you turn your new users into returning users
User Collection: These reports provide insights on the makeup of users visiting your website, which includes:
(E) Demographic Data: Categorizes users by age, location, and interests
(F) Tech Data: Categorizes users by the technologies (device, browser, operating system, etc.) they operate to access your content
In the following sub-sections, let’s delve deeper into what each of these reports entails.
LIFE CYCLE COLLECTION
As mentioned, the Life Cycle Collection uses data to paint a picture of your customers’ journey within your website or app, from the acquisition stage through to the conversion stage.
ACQUISITION OVERVIEW REPORT
GA4’s Acquisition Overview Report comes with an overview card that highlights your property’s key acquisition metrics, including users, event count, conversions, and total revenue.
Referring to this overview card helps you understand your website’s performance in terms of user acquisition. For example, you could analyze whether your website attracted more users this month than the last. This card may also include tabs highlighting data anomalies for a metric at a specific point in time to flag any data points that may be cause for concern.
Moreover, within the Acquisition Overview Report, you‘ll also see cards that summarize data from the User– and Traffic Acquisition Reports.
USER ACQUISITION REPORT
By default, GA4’s User Acquisition Report showcases the channel(s) that first directed users to your website or app, as well as the total number of new users (i.e., the New Users metric) that interacted with you via those channels.
For example, say you acquired a new user in January who did not interact with your website or app until they did so again in April. In this case, the User Acquisition Report will show you data about that specific user, including how you first acquired them back in January.
WANT DIGITAL INSIGHTS STRAIGHT TO YOUR INBOX?
TRAFFIC ACQUISITION REPORT
GA4’s Traffic Acquisition Report displays data about new sessions on your website or app from both new and returning users.
By default, the report follows the Session default channel grouping dimension, which breaks down user sessions and the respective channels that referred them. It also shows the total number of sessions that began on your website or app, as well as the number of sessions that:
- Lasted longer than 10 seconds
- Triggered a conversion event, or
- Had two or more screen or page views (i.e., the Engaged Sessions metric)
Note: To reiterate, a user represents an individual who has visited your site, while a session reflects one of those visits. Therefore, if an individual visited your website or app multiple times, the session count would increase, whereas the user count would remain the same. This fundamental difference affects the acquisition data highlighted in both the User- and Traffic Acquisition Reports.
ENGAGEMENT COLLECTION
GA4’s Engagement Collection allows you to measure user engagement and conversion events, helping you better understand user behavior through events.
ENGAGEMENT OVERVIEW REPORT
GA4’s Engagement Overview Report comes with an overview card highlighting key engagement metrics that reveal how long users stayed on your website or app before leaving, including average engagement time, engaged sessions per user, and average engagement time per session.
EVENTS REPORT
GA4’s Events Report shows a complete list of all recorded events, including how many times each logged event was triggered (i.e., Event Count metric) and the breakdown of total users associated with those events (i.e., Total Users metric).
CONVERSIONS REPORT
GA4’s Conversions Report only displays events that you’ve marked to qualify as a conversion. Thus, whenever a user triggers any one of those events, you’ll be able to view data specific to that event in the report.
PAGES AND SCREENS REPORT
The Pages and Screens Report breaks down the page and screen views that users visited most frequently on your website and apps, respectively. A pageview can include the initial loading of a webpage, a reload, or a revisit on that page. Screen views work like pageviews, except they track views on mobile apps.
Altogether, this data helps you understand what content your users find most engaging based on their view count and interactions.
MONETIZATION COLLECTION
GA4’s Monetization Collection lets you view valuable data about your ecommerce-related ads and subscriptions, including how much revenue you’re generating, the number of ad impressions, and the number of ecommerce purchases from your online store.
MONETIZATION OVERVIEW REPORT
GA4’s Monetization Overview Report has an overview cart highlighting key metrics about your website or app’s monetization, such as total revenue, ecommerce revenue, and total ad revenue.
ECOMMERCE PURCHASES REPORT
GA4’s Ecommerce Purchases Report is where you’ll find data specific to the items you sell, such as the revenue generated by each item and any user interactions with your item listings.
To populate data in this report, you’ll first need to set up certain ecommerce events. For example, you may want to track some of GA4’s Recommended Events like purchase, refund, and view cart to learn more about your users’ shopping experience.
Conveniently, Google provides a list of events and associated parameters that makes it easier to begin collecting data about your e-commerce store activity.
IN-APP PURCHASES REPORT
Despite forming part of your e-commerce data, GA4 has a separate report to view in-app purchases, which comes in handy for monitoring conversions that exclusively take place on your mobile app(s).
Here, you’ll gain insights into how in-app purchases vary in volume over time and a comparison between product quantity and revenue generated.
PUBLISHER ADS REPORT
GA4’s Publisher Ads Report enables you to measure revenue generated from the ads shown in your mobile app. To view this data, you’ll need to link your GA4 property to your Google Ads account:
After linking your GA4 account to Google Ads, you’ll be able to see your ad performance over time in relation to revenue growth.
RETENTION REPORT
GA4’s Retention Report helps you determine how frequently users—or rather, different cohorts of users—engage with your website after their first visit.
In GA4, a cohort is any group of users that shares a common characteristic identifiable by an analytics dimension. For instance, a cohort could comprise all users acquired by you on a particular day. In another example, a cohort could include only new users, classified by you as users without an existing Google Analytics cookie and client ID from your site (or app instance ID from your app).
With this data, you can track the proportion of new versus returning visitors and visualize your retention and engagement rates over time.
DEMOGRAPHICS COLLECTION
GA4’s Demographics Collection breaks down the proportion of your website or app visitors by country, city, gender, language, interests, and age. The report’s blend of interactive and color-coded charts, diagrams, and tables all help with data visualization.
DEMOGRAPHICS OVERVIEW REPORT
The Demographics Overview Report provides snapshots of crucial demographic metrics you wish to track, such as user age and location. You can click the expansion button at the bottom-right of any chart to view their information in further detail.
DEMOGRAPHICS DETAILS REPORT
GA4’s Demographics Details Report provides a series of interactive charts—commonly bar charts and scatter plot diagrams—that help you visualize the origins of your website and app traffic.
The report comprises three key components:
- Users by Country: The bar chart (top-left in the image) displays the countries with the most users visiting your website or app.
- Users and New Users by Country: The scatter plot diagram (top-right in the image) shows the countries with the most site visitors broken down by users (x-axis) and new users (y-axis).
- Table Overview: The table (bottom in the image) displays your site traffic by country in an interactive, tabular format. To customize this, simply click on the “+” (plus) button to add any event or metric you wish to examine.
TECH COLLECTION
GA4’s Tech Collection tells you all about what technologies your users use to access your website or app—everything from their choice of device, browser, operating system, and even screen resolution.
With this information, you can carry out all kinds of website troubleshooting, such as optimizing the mobile-friendliness of your site if the majority of your users are on mobile.
TECH OVERVIEW
The Tech Overview Report offers a comprehensive overview of your users’ choice of technologies, including:
- A pie chart showing what platform the majority of your visitors used to visit your website or app
- A graph showing in real-time the number of visitors by platform in the last 30 minutes
- And much more
TECH DETAILS
By default, GA4’s Tech Details Report shows you three key elements:
- Users by Browser Over Time: The chart (top-left in the image) displays the most popular browsers used by users to visit your website or app over time.
- Users and New users by Browser: The scatter plot diagram (top-right in the image) shows the browsers associated with the most incoming traffic, broken down by users (x-axis) and new users (y-axis).
- Table Overview: The table (bottom in the image) displays the most popular browsers used by your site visitors in an interactive, tabular format. To customize this, simply click on the “+” (plus) button to add any event or metric you wish to examine.
Tracking Events and Conversions in GA4In this beginner’s guide to GA4, our focus is primarily on the basics of event tracking, specifically on events tracked automatically. Even though we’re only scratching the surface, harnessing the power of these auto-tracked events can offer substantial insights.
The events tracked by GA4 by default include:
- click
- form tart
- form submission
- file download
- page view
- scroll
- session start
- user engagement
- video start
- video complete
- video progress
- view search results
Besides, GA4 also automatically track the below event parameters:
- page location
- page referrer
- page title
- screen resolution
- language
While the above can give you meaningful data and insights, you have the option to delve deeper by creating custom events based on the automatically tracked ones.
Go to Events under Admin – Property and click the Create event on the top right corner.
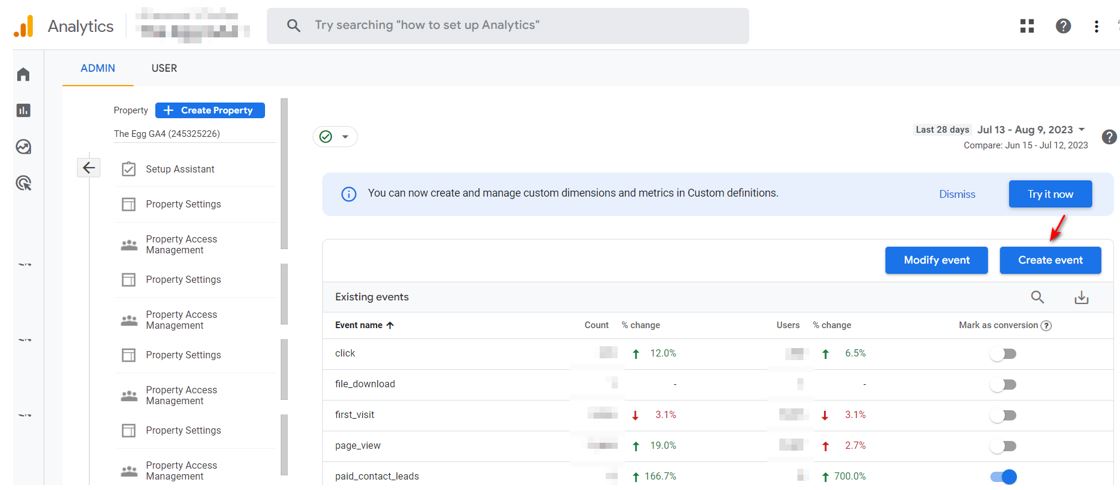
Create events in GA4
Alt txt: Create events in GA4
For example, we can create a newsletter signup event by specifying event name equals page view and page location equals the signup confirmation or thank you page that visitors will see after they sign up for your newsletter.
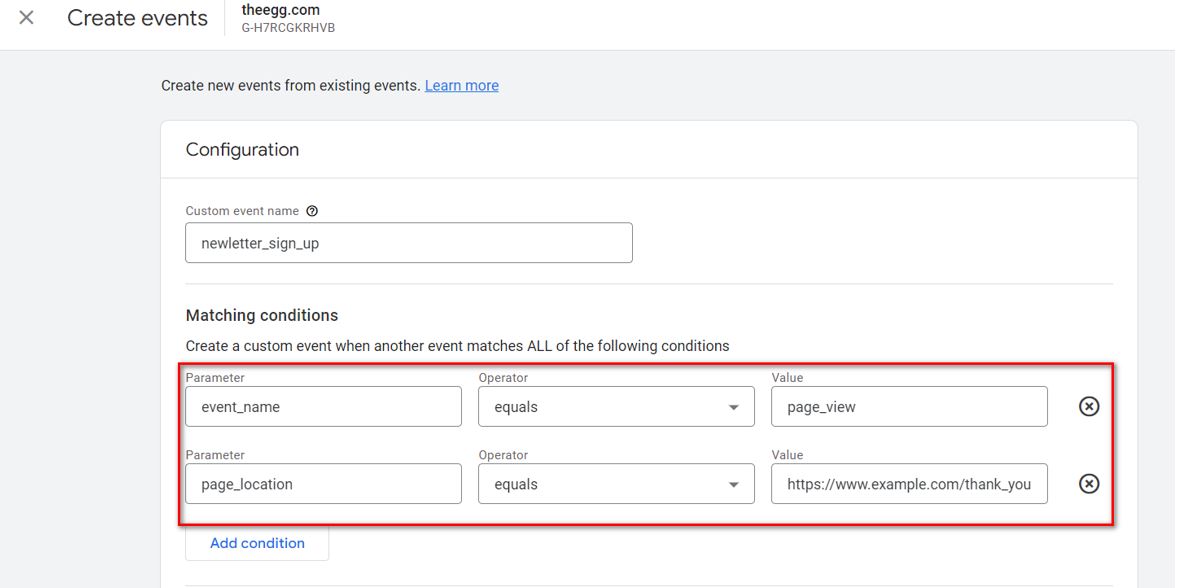
Set up event parameters in GA4
Alt txt: Set up event parameters in GA4
After you create the event, you can mark it as Conversions by toggling it over on the Event page, under Mark as conversion.
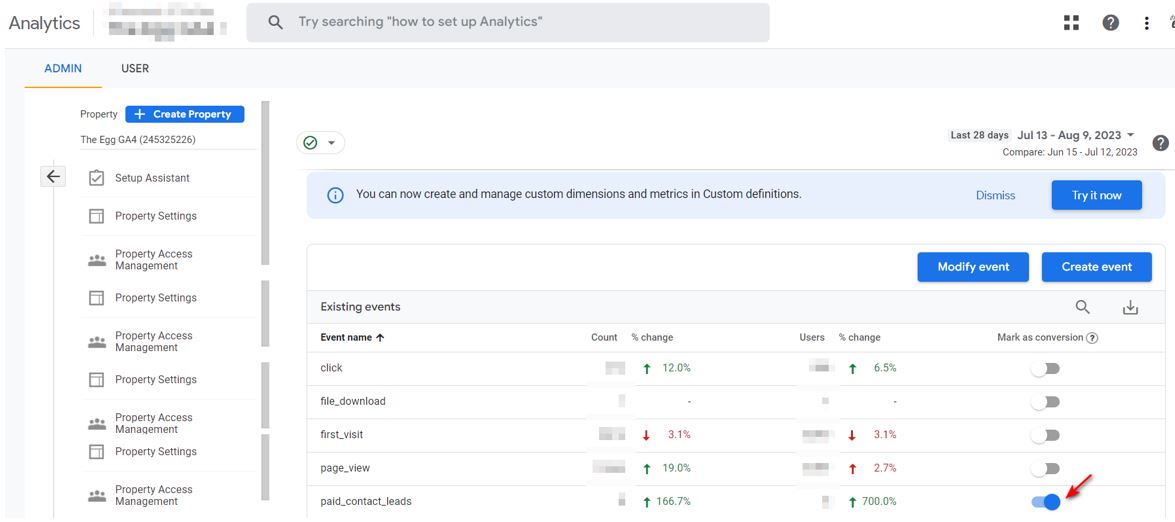
Set up conversions in GA4
Alt txt: Set up conversions in GA4
CONCLUSION
With these new GA4 reports, you’ll be able to utilize data to draw more meaningful insights and make informed marketing decisions based on what your users do at each step of the conversion process.
It can be a hassle to immediately hop onto GA4 after mastering Universal Analytics. But once you’ve overcome the initial learning curve, you’ll find that GA4 is much better geared towards understanding today’s cross-platform and multi-device users.
With that said, stay tuned for a more advanced guide to GA4 in our upcoming article